
Still deciding? See what LMS Reporting in Continuum Learn can do for your organisation.
Continuum has a set of reports under Manage > Reporting. Between them they tell you who is active, who has finished which course, how learners scored in quizzes, what they said in surveys, who holds a programme certificate, and how your live events and replays are being watched. Most reports can be filtered on screen and exported to a spreadsheet.
Who can do this: team admins see every report. Presenters see a smaller version for the courses they present (see What presenters can see).
Which report do I need?
Click Reporting in the Manage menu. The tabs along the top are the reports.
| Your question | Report | Where |
|---|---|---|
| Are people logging in and learning this month? | User Activity | Manage > Reporting > User Activity |
| How many people finished this course? Who hasn't started? | Course Reporting, then Results for the course | Manage > Reporting > Course Reporting |
| Which learners attended my face-to-face session or live event? | Course Reporting, then Results for the course | same |
| Has this learner met the assessor sign-off? Can I download their certificate? | Course Reporting, then Results for the course | same |
| How did learners do in a quiz, and which questions are hardest? | Quiz Results on the course's results page | same |
| What did learners say in the survey? What is the course rating? | Survey Responses and Course rating on the course's results page | same |
| What has one person completed across all their courses? | User Reporting | Manage > Reporting > User Reporting |
| Who has earned a programme certificate, and how quickly? | Programmes | Manage > Reporting > Programmes |
| Who left a course, and when? | Unenrollment Report | Manage > Reporting > Unenrollment Report |
| How many people watched my live events and replays? | Watch Reporting | Manage > Reporting > Watch Reporting |
Tip: Manage > Courses is for enrolling groups and people (its tabs are Groups, Users, Notifications and Reminders). It doesn't show results. Go to Course Reporting for those.
Understand the key terms
These words appear in several reports. They mean different things, so it is worth getting them straight.
| Term | What it means |
|---|---|
| Enrolled | The learner has been given the course, directly or through a group. |
| Accessed | The learner has opened the course at least once, at any time. |
| Percent Completed | How much of the course the learner has finished. 100% means they have completed it. |
| Completed | The learner has reached 100%. |
| Attended | Only for courses with a date, such as face-to-face or live online events. The learner took part on the day of the event, or you marked them as attended by hand. |
| Signed off | Only for courses where an assessor must confirm competence before the certificate is issued. The learner can finish all the content and still wait for sign-off. |
So "completed" is about the learner's progress through the content, "attended" is about being at a dated event, and "signed off" is a person confirming the learner is competent. A learner can be one without the others.
User Activity
Question it answers: how engaged are my learners overall?
At the top you will see Active Users, Total Activities, Avg Daily Active and Days in Period. If you run live events, cards for streamers and live and replay minutes appear too. Active Users by Activity Type shows how many people did each kind of thing, and Activity Trends plots each day.
The table below lists one row per person, per type of activity, per day: User Name, Email, Activity Type, Activity Date, Last Active Time and Daily Count. The types are Learning, Login, Email Open, Email Click and Course Enrollment.
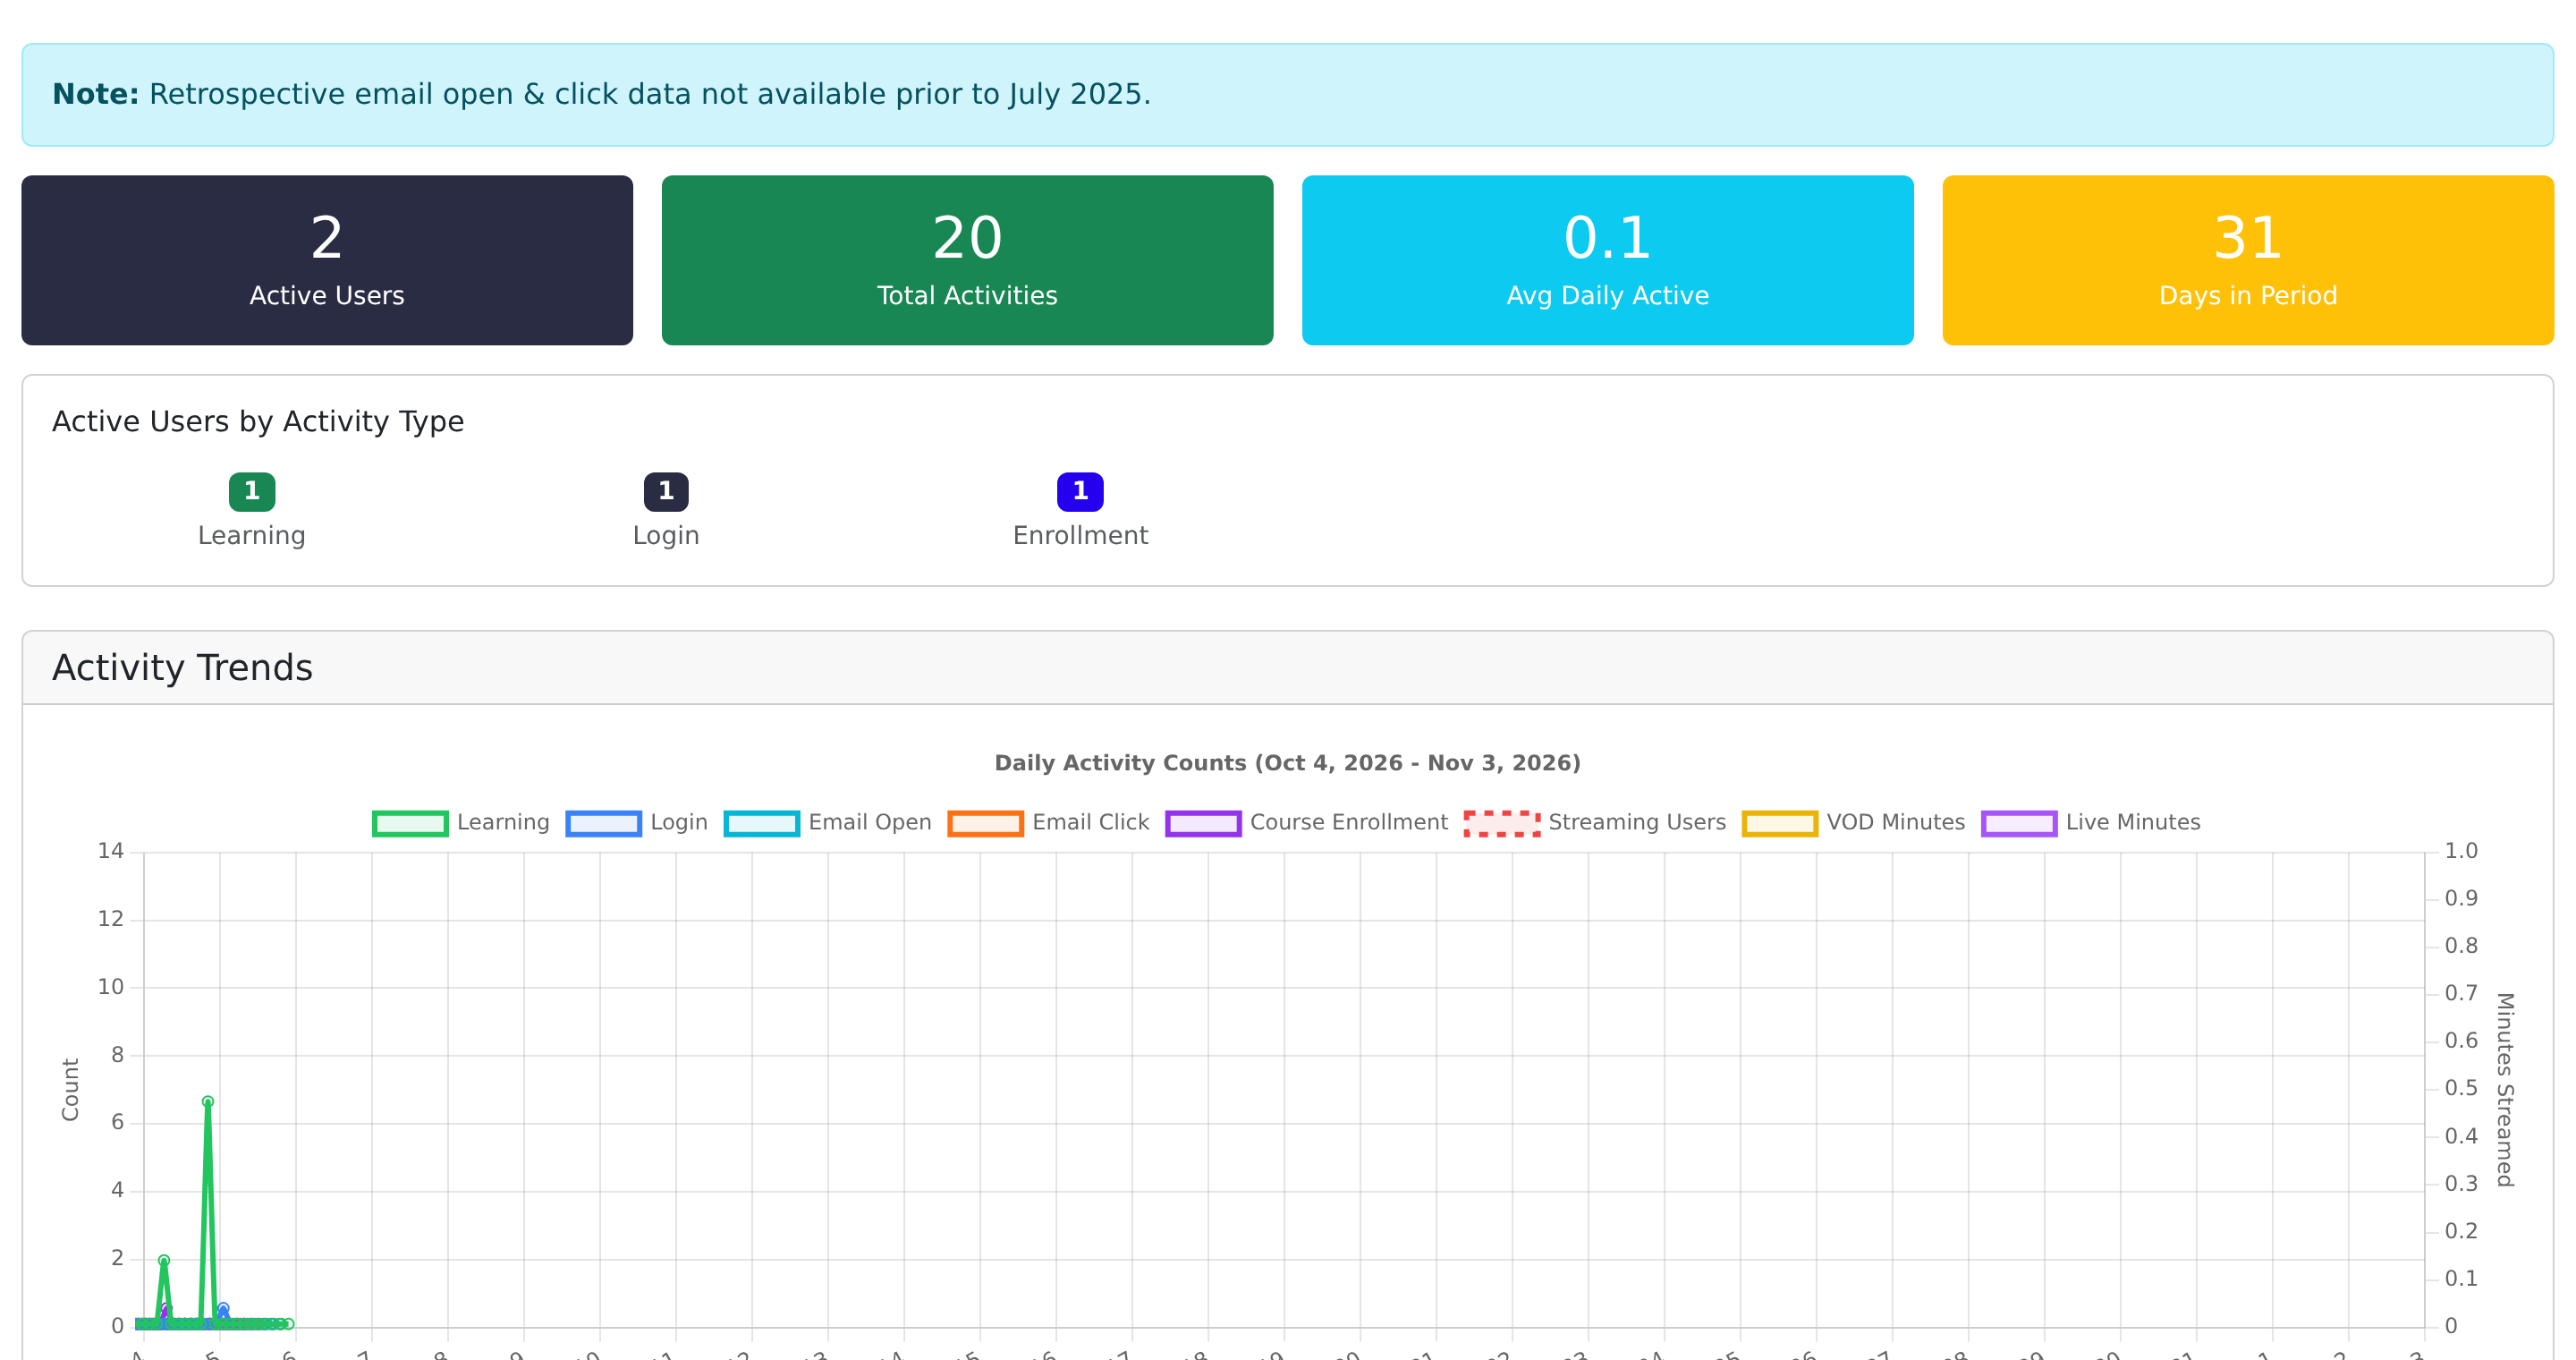
Filters: the report opens on the last 30 days. Use the quick buttons (Last 30 Days, This Month, Last Month, Last 6 Months, Last 12 Months, Previous 12 Months) or pick your own dates. You can also search for a user and filter by activity type. The chart is switched off for ranges longer than 12 months, but the table still works.
Good to know: email opens and clicks are only recorded from July 2025. This report has no CSV button.
Course Reporting
Question it answers: how is each course doing?
Manage > Reporting > Course Reporting lists every course with one row of totals. Click Results to open that course's learner-level report.
| Column | Meaning |
|---|---|
| Name | Course title. |
| Course Type | Face to Face, Live Event (Online) or E-Learning Course. |
| Date | The date of a dated course. Blank for self-paced courses. |
| Completed | Learners enrolled who have reached 100%. |
| Enrolled | Learners currently enrolled. |
| Attended | Dated courses only: learners who took part on the day, including those you marked by hand. |
| Accessed | Learners who have opened the course at any time. |
| Did not Attend | Dated courses only: enrolled minus attended. |
| % Places Filled | For courses with limited places. |
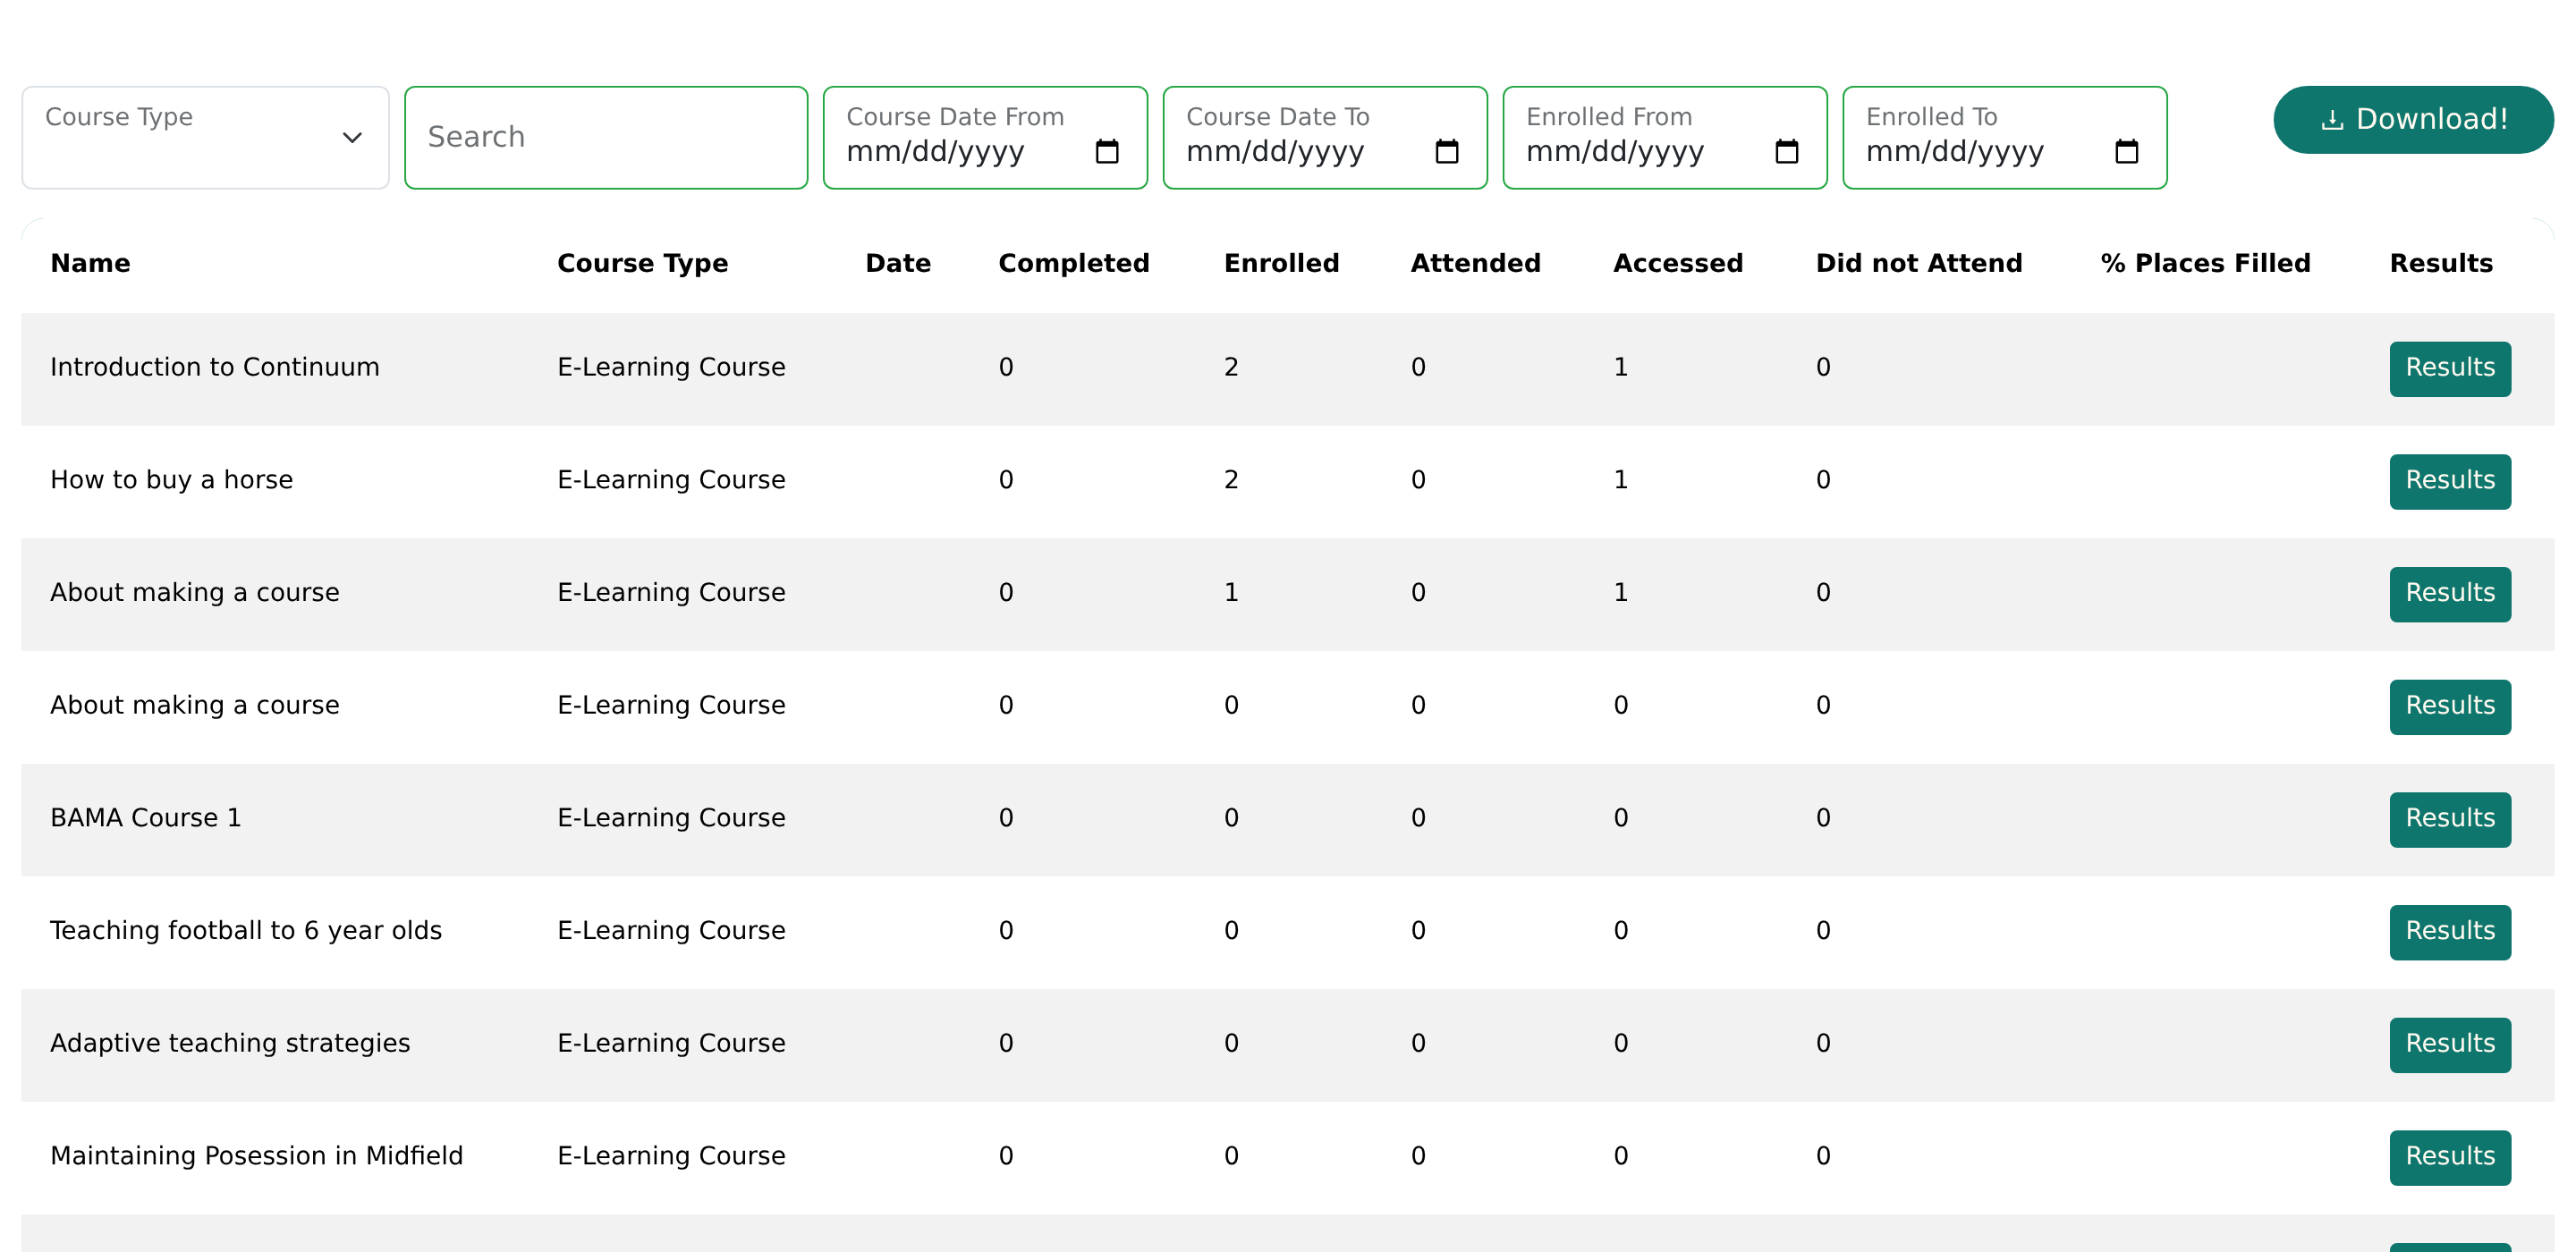
Filters: course type, a title search, Course Date From and To, and Enrolled From and To (only learners enrolled in that window are counted). Click Filter to narrow the counts by your custom signup fields, for example region or job role. There is no separate group filter, so if you need to slice by team or branch, use a custom field.
CSV: Download! exports one spreadsheet containing the learners of every course that matches your search and course dates, with the same columns as the per-course download described below. The course type filter applies to the download too, so choosing E-Learning Course exports only e-learning courses.
A single course's results
Click Results on a course to open its report. The page title is the course name; Back to Reports returns to the list, and Download CSV at the top right exports the learners (see CSV export below).
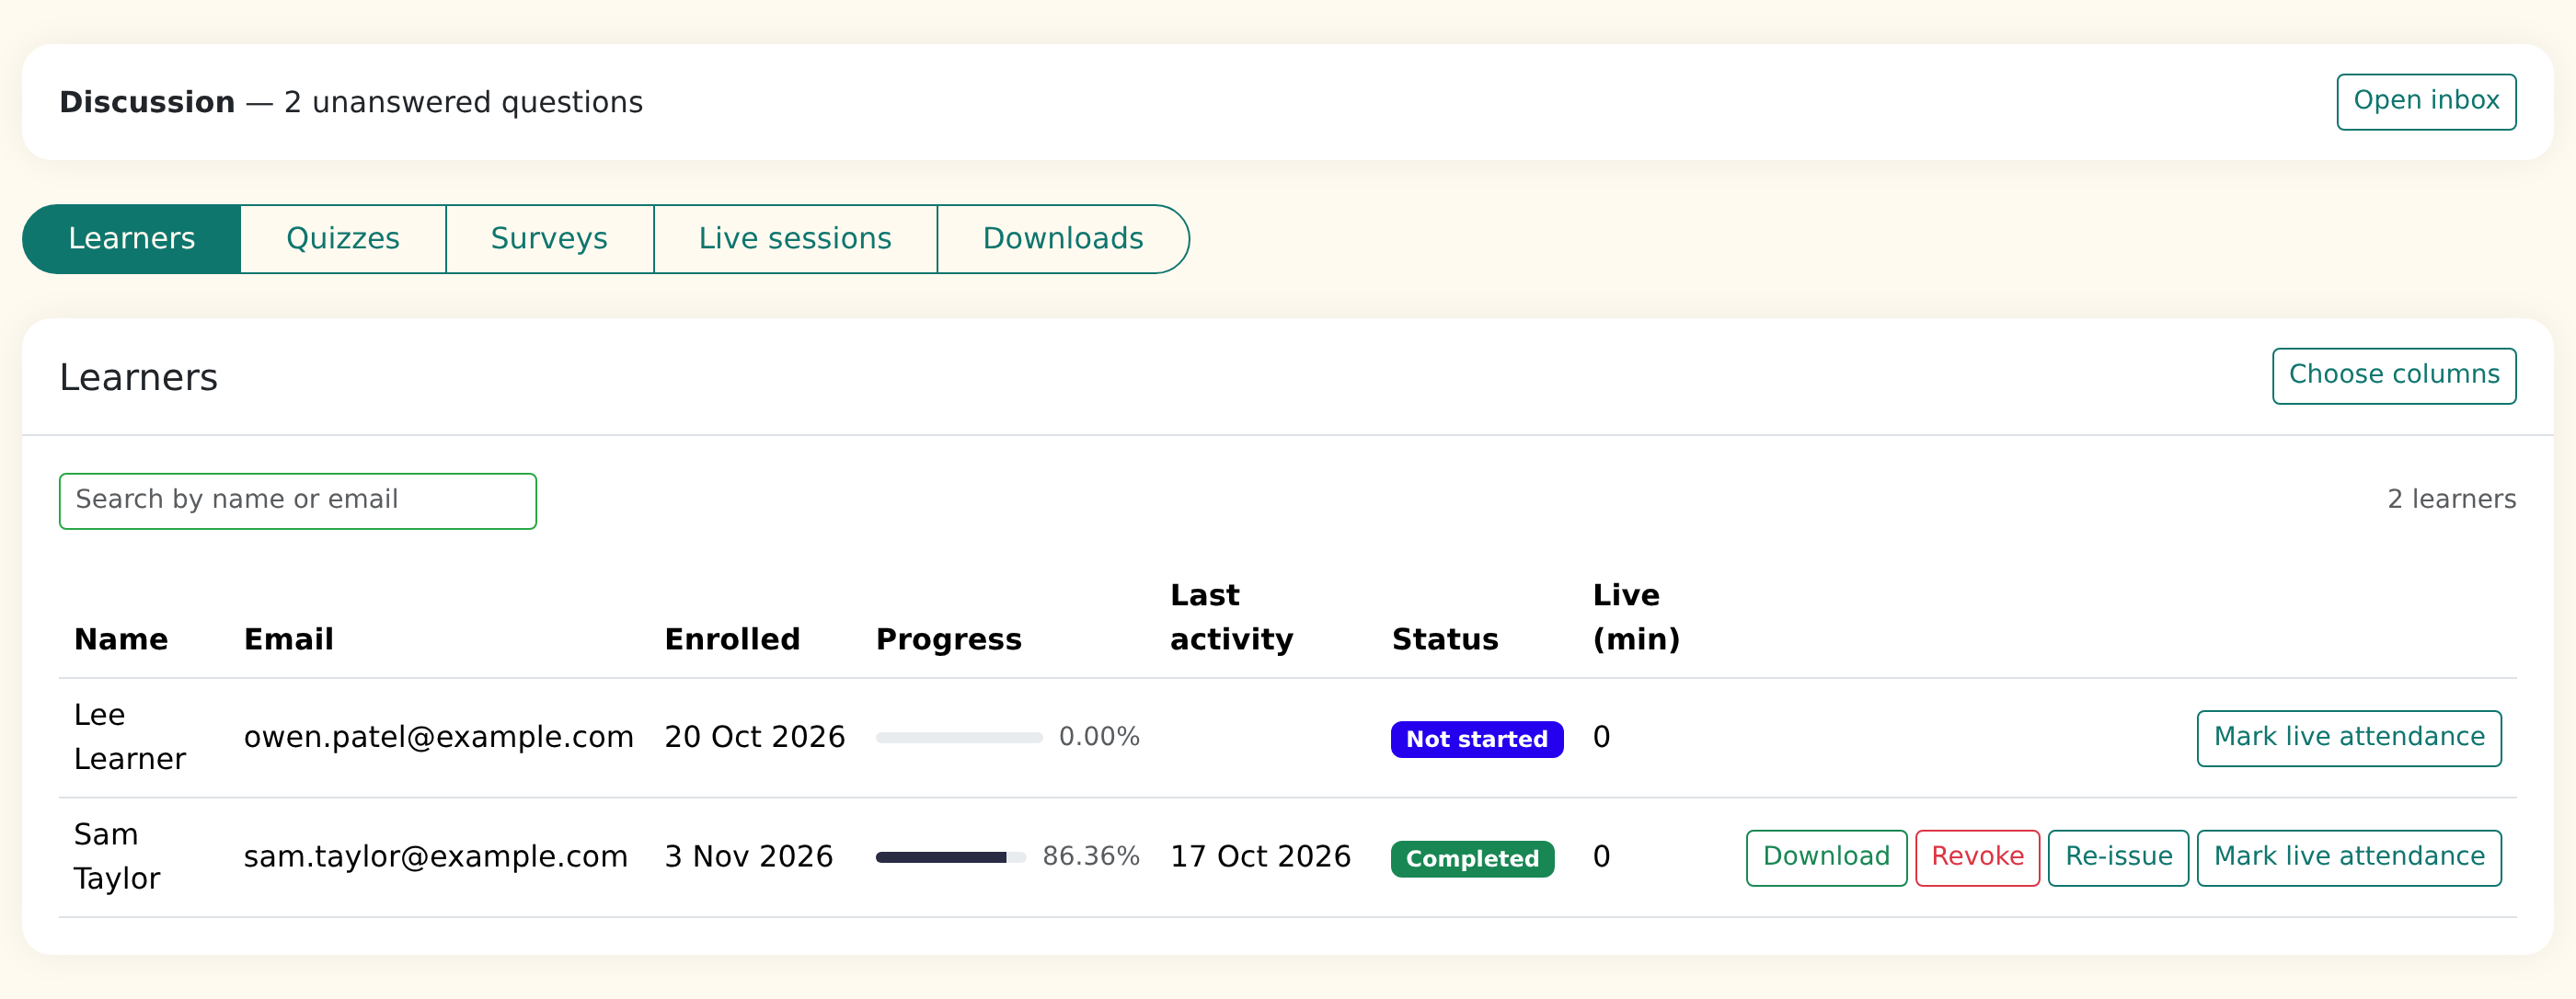
If the course has a discussion board, a Discussion strip under the title shows how many questions are unanswered, with an Open inbox button that takes you to the presenter area inbox.
The report is split into tabs: Learners, Quizzes, Surveys, Live sessions (only for courses with Zoom sessions) and Downloads. The tab you pick is kept in the page address, so you can bookmark or share a link straight to it.
The learner table
The Learners tab lists everyone enrolled, including people who have since left, who are marked Unenrolled so you keep the history.
| Column | Meaning |
|---|---|
| Name, Email | The learner. Search by either with Search by name or email. |
| Enrolled | When they enrolled. |
| Progress | A progress bar and percentage. |
| Last activity | The last time they were in the course. |
| Status | Not started, In progress or Completed. |
| Attended | Only on courses with a date. Click Confirm attendance when someone came, for example if they didn't use the app on the day. The row then shows Attended with an Undo button. |
| Live (min) | Only on courses with Zoom sessions: how many minutes the learner spent in the meetings. |
| Sign-off | Only on courses that need assessor sign-off. Click Sign off, add an optional note, and the learner shows as Signed off (hover to see who signed off). Undo sign-off withdraws it. |
The buttons at the end of each row are for certificates and live attendance (below). Long lists are split into pages with Previous and Next.
Choose columns adds your custom signup fields. For each field you pick, a small summary of the answers appears above the table.
Confirming attendance also releases any certificate or completion email that was waiting for it on a face-to-face course. Signing off does the same for courses that need sign-off: it triggers the certificate, and any programme award that was waiting on it.
Download a learner's certificate
Click Download at the end of the learner's row. The button appears once the learner has completed the course (100%) or has a certificate on record. It doesn't appear for learners who have only opened the course or attended. You get their issued certificate with its date and number.
Revoke withdraws a certificate and its digital credential, so anyone checking it will see it as revoked. Re-issue replaces an expired, revoked or out-of-date certificate with a new one.
CSV export
Click Download CSV at the top of the page. The file contains one row per learner, including unenrolled ones, with: Course Title, Name, Email, Attended, Live Attendance (min), Accessed, Unenrolled, Unenrolled Date, Percent Completed, Start Date, Completion Date, Last Accessed Date, Quiz Attempts, Quizzes Passed, Avg Best Quiz Score, and then one column per custom signup field. The download always includes every learner, whatever you typed in the search box.
Quiz results
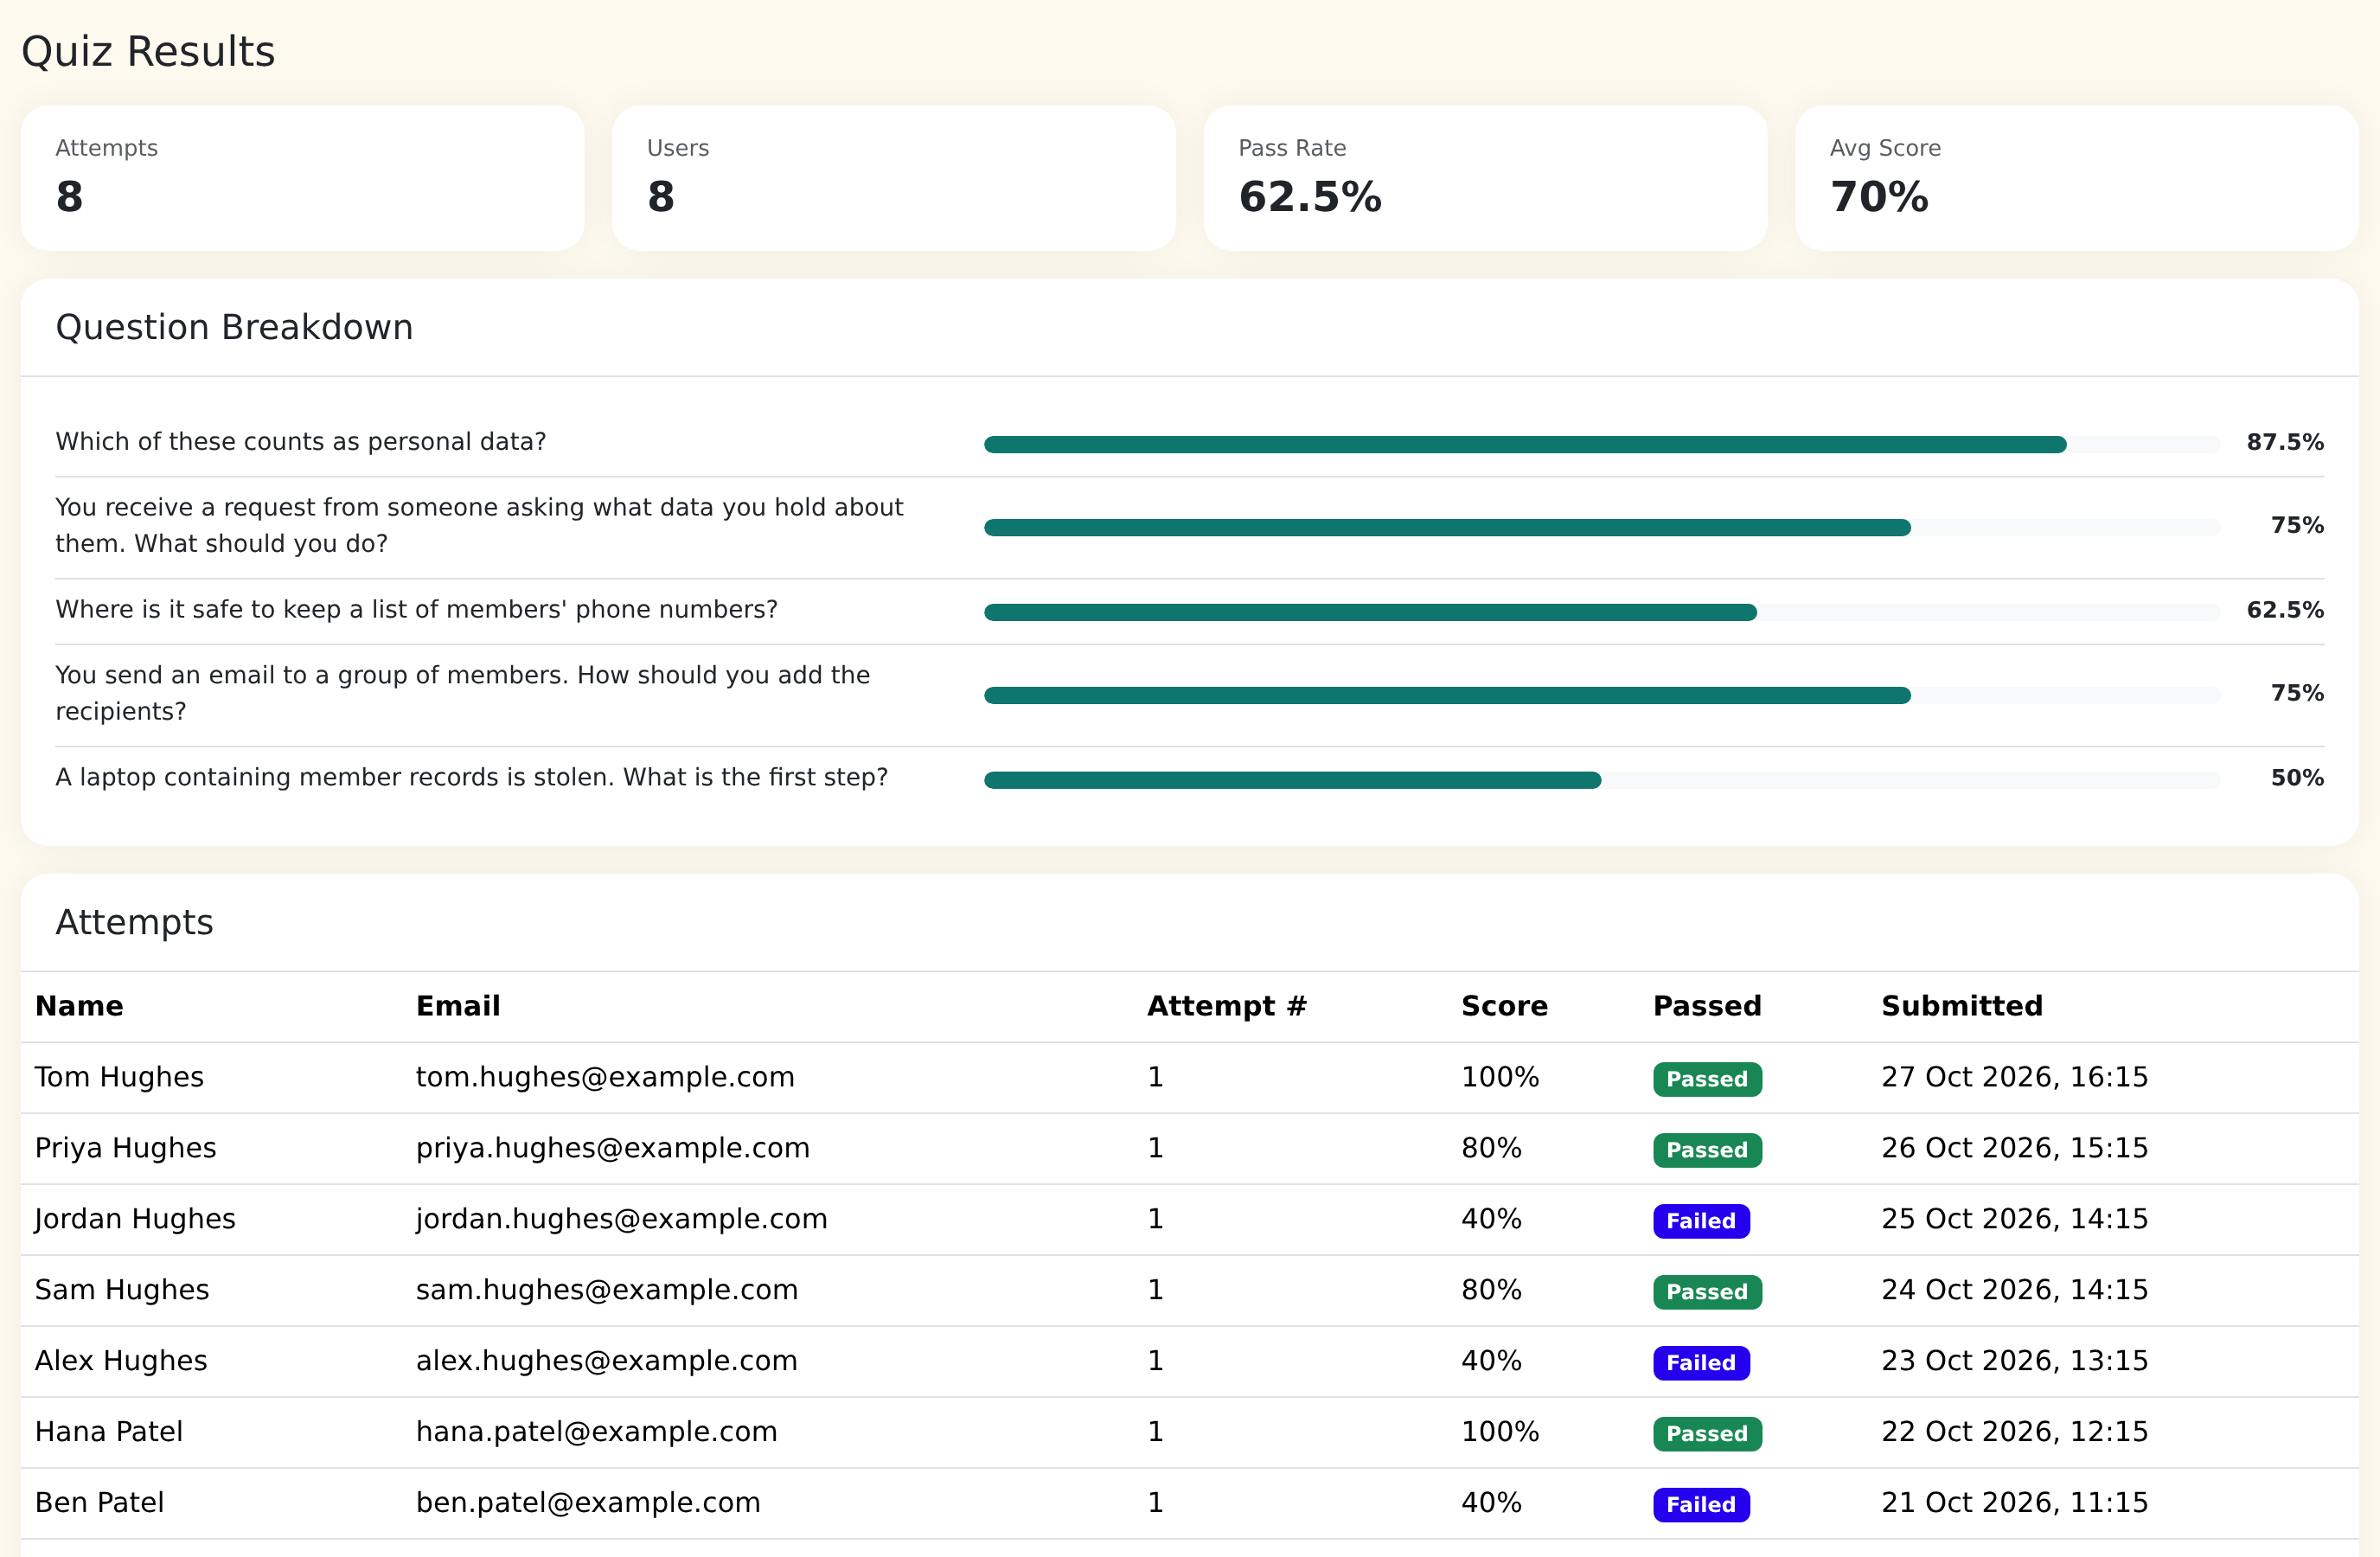
The Quizzes tab shows Attempts, Users, Pass Rate and Avg Score. Question Breakdown shows the percentage of correct answers for each question, so you can spot the ones people find hard. Attempts lists every submitted attempt with name, score, passed or failed, and date. When the course has more than one quiz, use the drop-down to switch.
Survey results and course rating
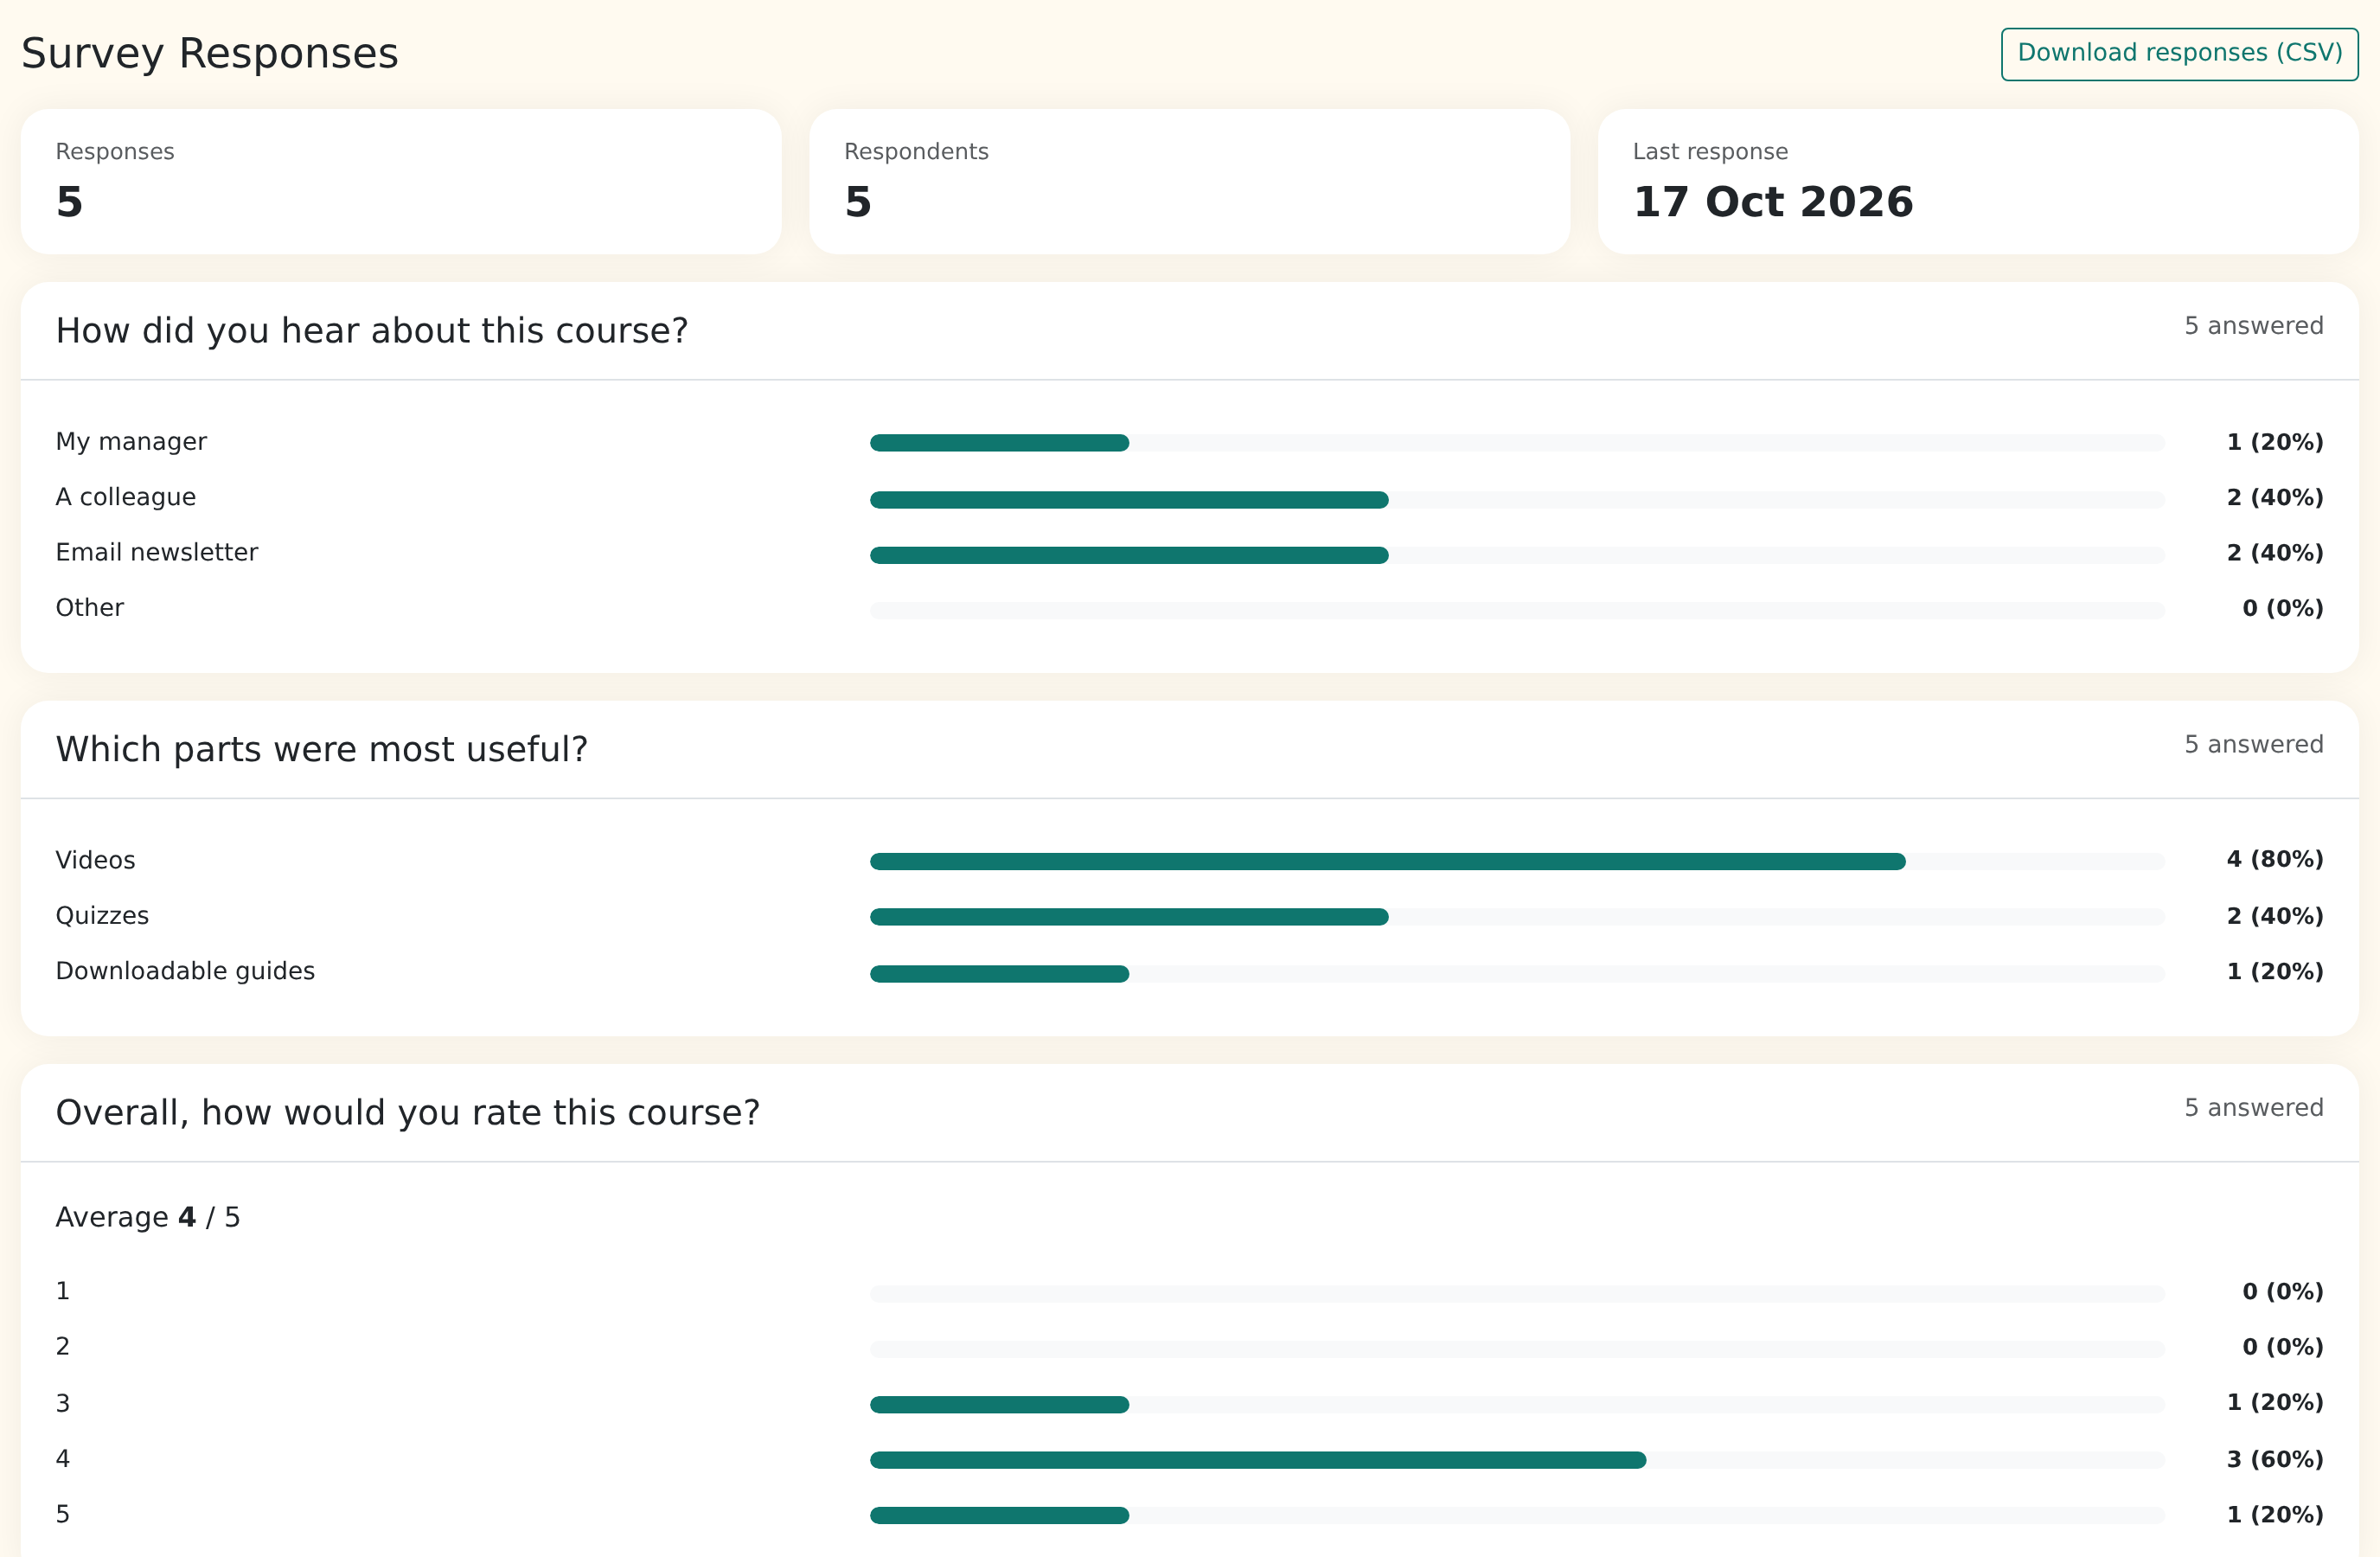
The Surveys tab summarises each survey question, with a Download responses (CSV) button. If learners left a star rating when finishing, a Course rating card shows the average, how many gave each rating, and their comments. Read more in How to create a survey.
Live sessions
Courses with Zoom sessions get a Live sessions tab showing each meeting's Status, Attendees, how many Completed, and how many were Unmatched, followed by an Attendance table of names, minutes and source. Click Refresh from Zoom to pull the latest attendance, and Mark attended to credit someone yourself. You can also click Mark live attendance on a learner's row in the Learners tab. People who were in the meeting but couldn't be matched to an enrolled learner are listed under Unmatched Zoom participants. See How to run Zoom sessions.
Downloads
The Downloads tab shows how many times each file in the course was downloaded, with the module and lesson it's in.
User Reporting
Question it answers: what has this person done across all their courses?
Each row is a learner, with counts split into In Person, Live Event and Course (self-paced). Use the drop-down beside the search box to switch the whole table between Enrolled Courses, Attended Courses and Completed Courses. Click Details on a row to see that person's list of courses with date, type and % Complete.
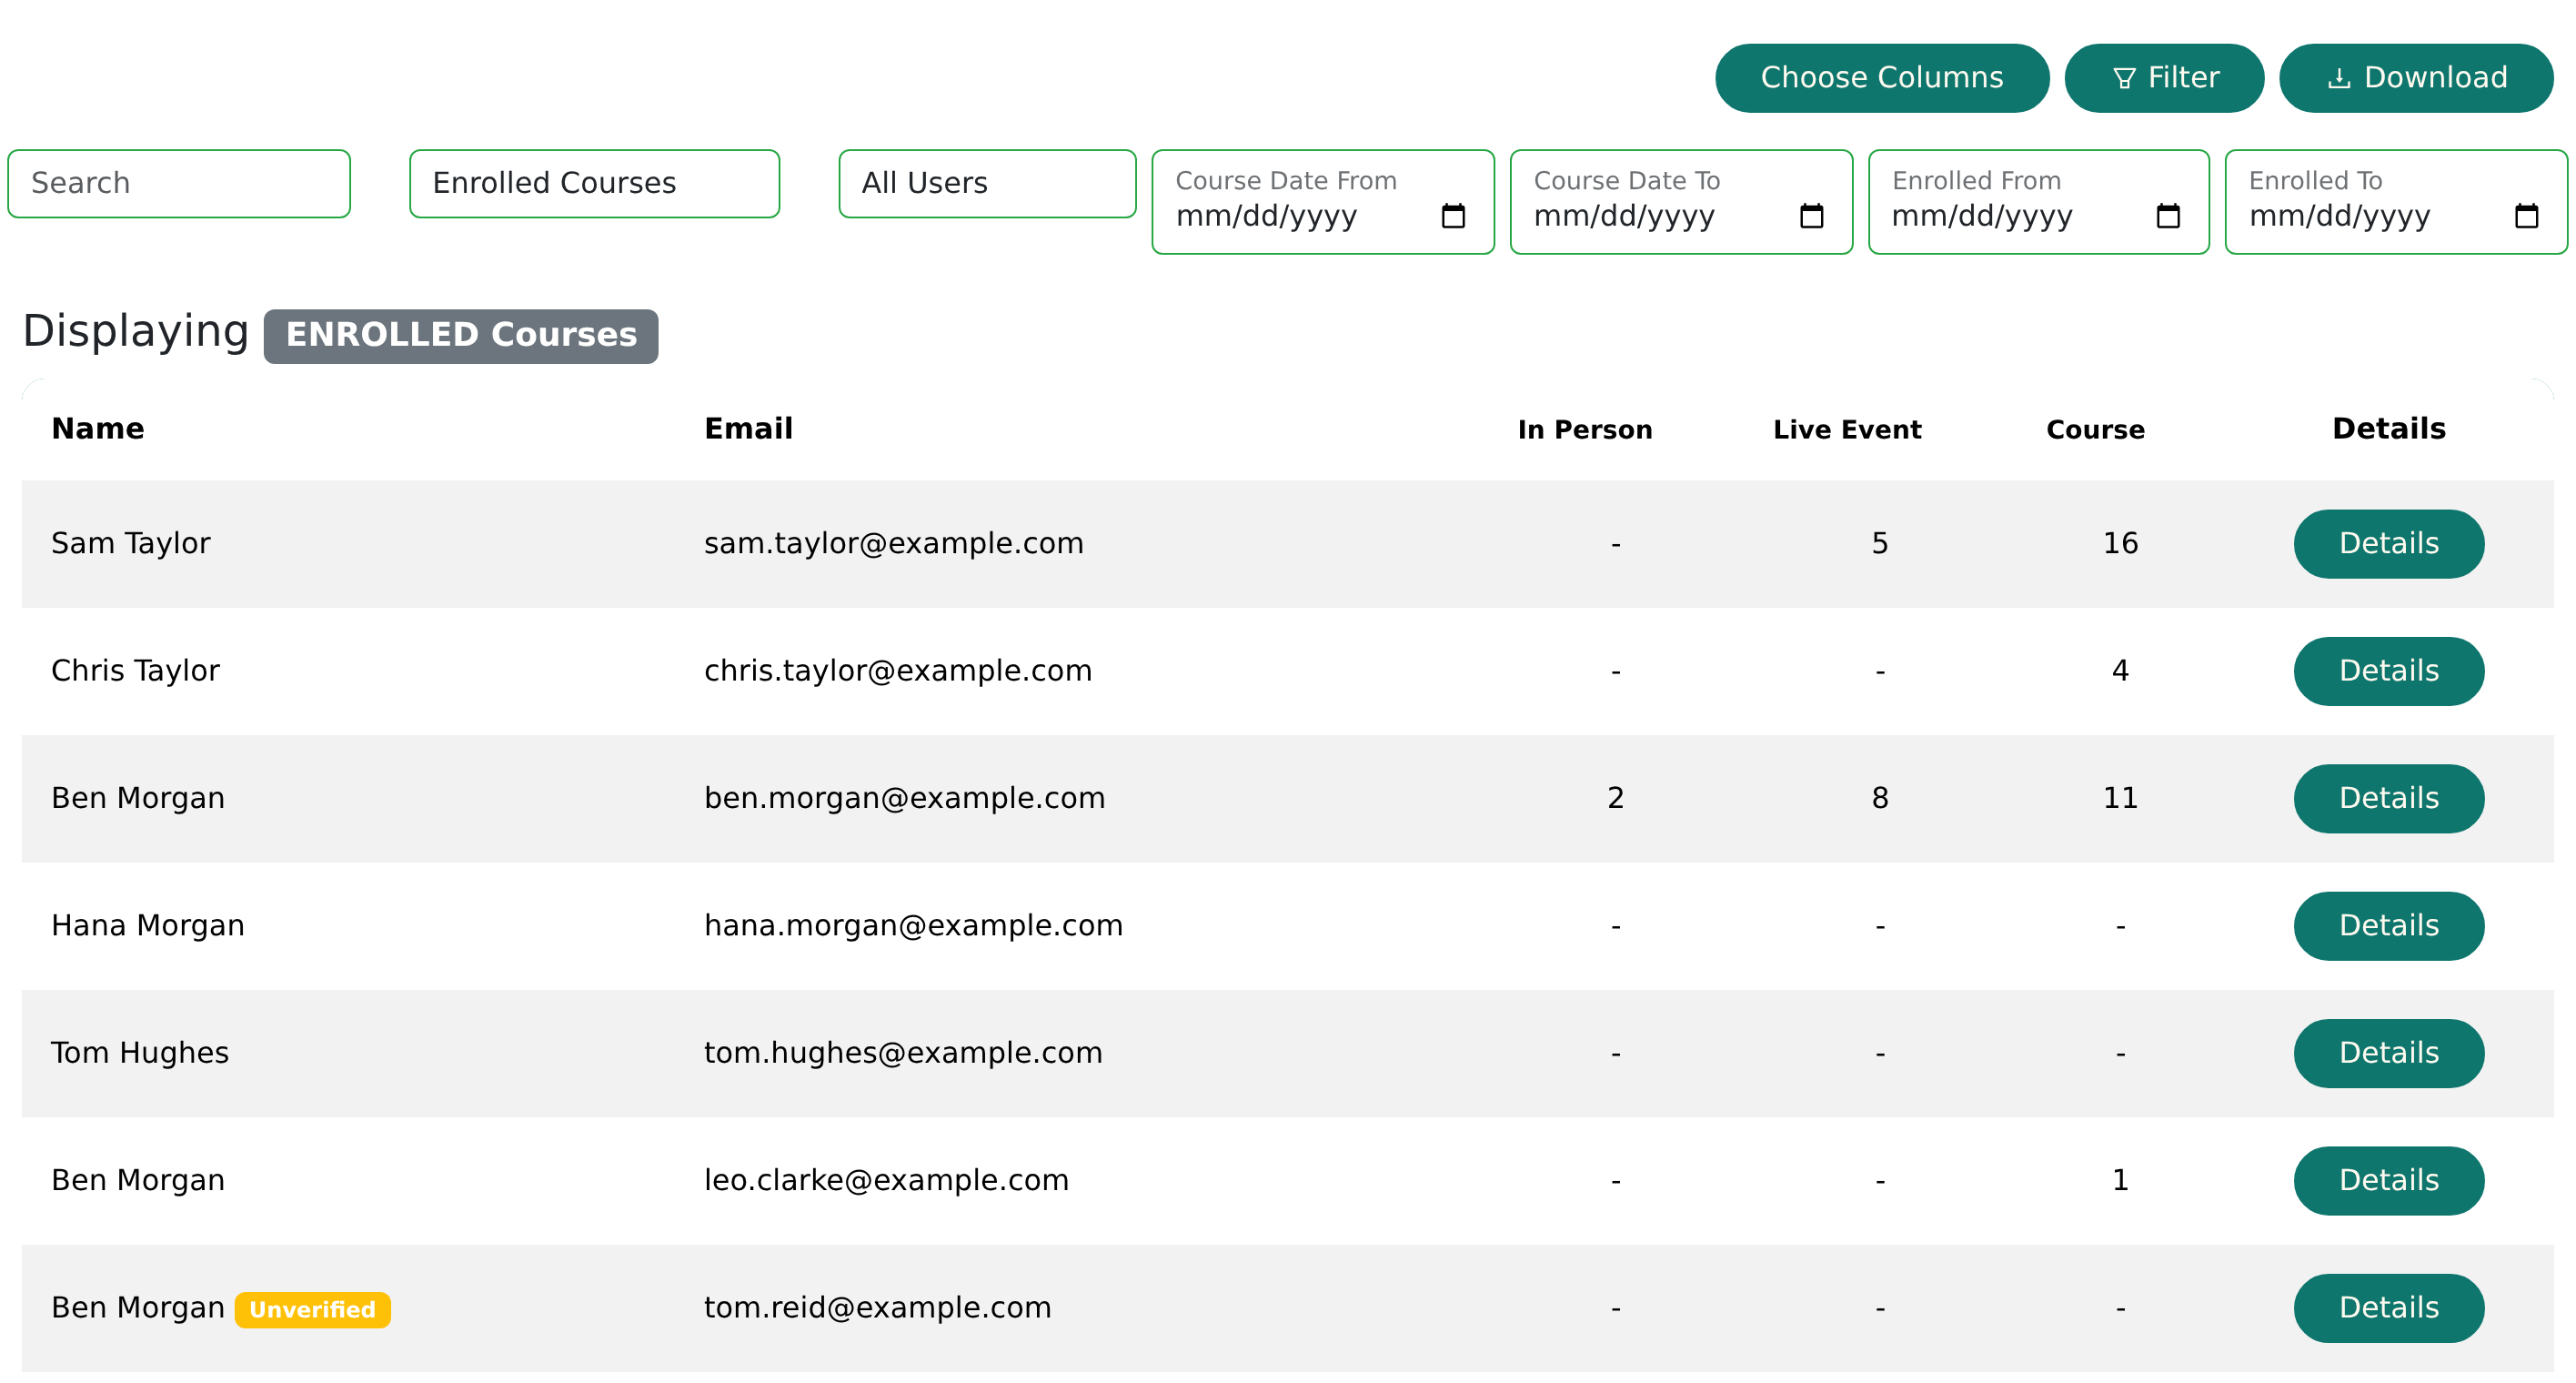
Filters: search by name or email, All Users or Unverified only (people who haven't confirmed their email), Course Date From and To, Enrolled From and To, and your custom signup fields under Filter. Choose Columns adds signup fields to the table.
CSV: Download exports the filtered list, with each person's roles, nine course counts (enrolled, attended and completed for each course type) and their signup fields.
Programmes
Question it answers: how many people are working towards and earning each programme certificate?
One row per programme, no filters.
| Column | Meaning |
|---|---|
| Enrolment | Explicit (learners are enrolled on the programme itself) or Implicit (anyone enrolled on a member course counts). |
| Registrants | Learners enrolled on an explicit programme, or enrolled on a member course for an implicit one. |
| Completers | Learners who hold a current award that hasn't been revoked. |
| Completion rate | Completers as a percentage of registrants. |
| Avg days to complete | Average time from starting to completing. |
| Awards | Every certificate ever issued, including re-issues. |
| Revoked | How many of those awards were revoked. |
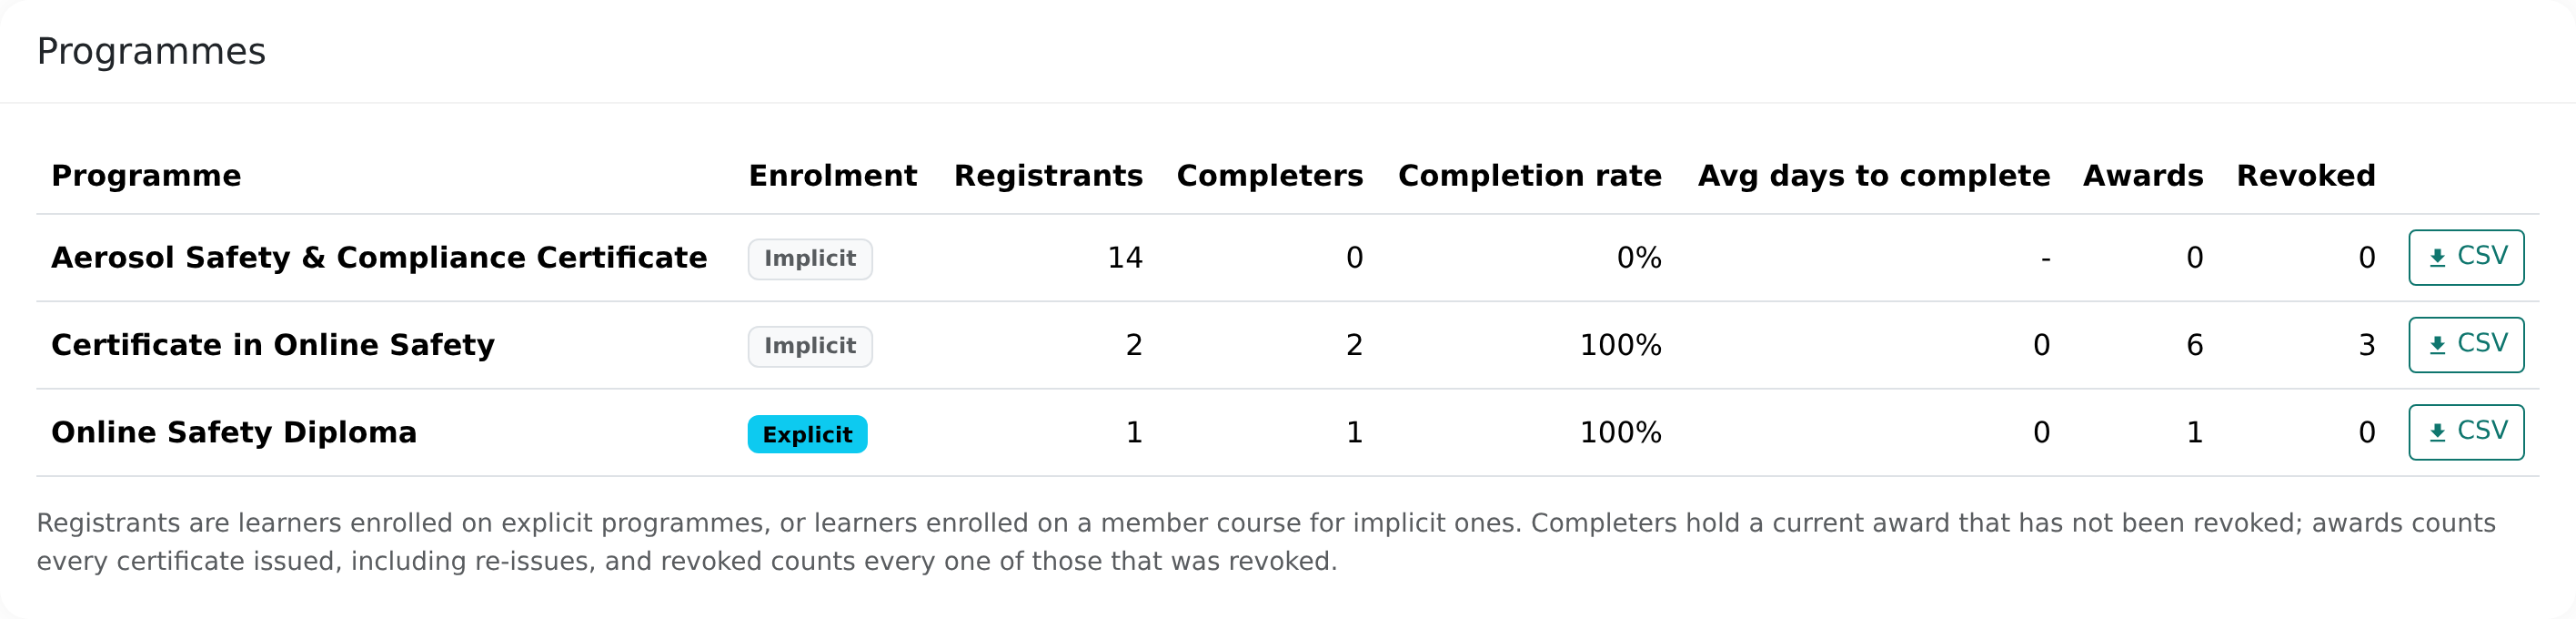
CSV: click CSV on a programme for one row per learner: Name, Email, Status, Intake, Started, Completed, Certificate number and Award state. If you use cohorts when enrolling learners, this is where the cohort name appears. See How to create a programme for how programmes work.
Unenrollment Report
Question it answers: who left which course, and when?
Columns: Name, Email, Course, Course Type, Course Date and Unenrolled Date. Filters: Unenrolled From and To, a title search, course type, and Course Date From and To. Download! exports exactly what you have filtered.
Watch Reporting
Question it answers: how are my live events and replays performing?
Use Last 30 Days, Last 90 Days, This Year or your own dates. The cards show Watch Time (split into live and replay), Unique Viewers, Peak Concurrent (the most people watching live at once), Completions (viewers who got through at least 90% of a replay), Purchases and Revenue. Watch Trend charts the period. Under Broadcasts, each event has its own viewers, watch time, peak, completions, purchases and revenue, split into direct sales and a share of any bundles that include it. Click a column heading to sort, or search by title. Click a title to open that event's own analytics.
If nobody has watched yet you will see "No watch activity yet". Export CSV downloads the broadcast table for the chosen dates.
What presenters can see
Presenters see learners, quiz and survey results for the courses they present, but not email addresses or custom fields. Admins can also use the presenter area, where they do see emails and a Full report link back to this page. See the presenter area guide.
Frequently asked questions
Why does a learner show 100% but "No" under Attended?
Percent completed measures the content. Attendance applies to dated courses and is recorded on the day of the event or by you. Click the plus button beside No in the course's learner table to mark them as attended.
Why is a course table empty?
Reports only count enrolled learners (and unenrolled ones in the per-course view). Check the course has enrolments, and clear any date or custom-field filters, which can hide everyone.
Can I report by group or cohort?
There is no group filter in these reports. Use a custom signup field (for example "Branch") with the Filter button on Course Reporting or User Reporting. Programme intake labels appear in the programme CSV. Rules-based cohorts (Manage > People > Cohorts) are for notifications and their own CSV download, not report filters; see groups and cohorts.
Why can't I see the Sign-off column?
It only appears for courses where you have switched on Require assessor sign-off before the certificate is issued in the course settings.
A learner has left. Are they still in the results?
Yes. In a course's results they stay with Unenrolled set to Yes and are included in the CSV. The Unenrollment Report lists them with the date.
Where is the CSV for User Activity?
That report is on-screen only. If you need the raw data, contact support.